Our journey with DevLake has represented a significant chapter in our quest for team health. Our objective was clear: to identify a tool that could offer insights on delivery, CI/CD process, etc; and actionable intelligence on our strengths and areas for improvement.
DevLake emerged as a compelling choice in this context since it promised to amalgamate diverse data streams into Grafana. The aim was to deliver a comprehensive view of team performance, project progression, and operational efficiency, enabling informed strategic decisions for enhancement and growth.
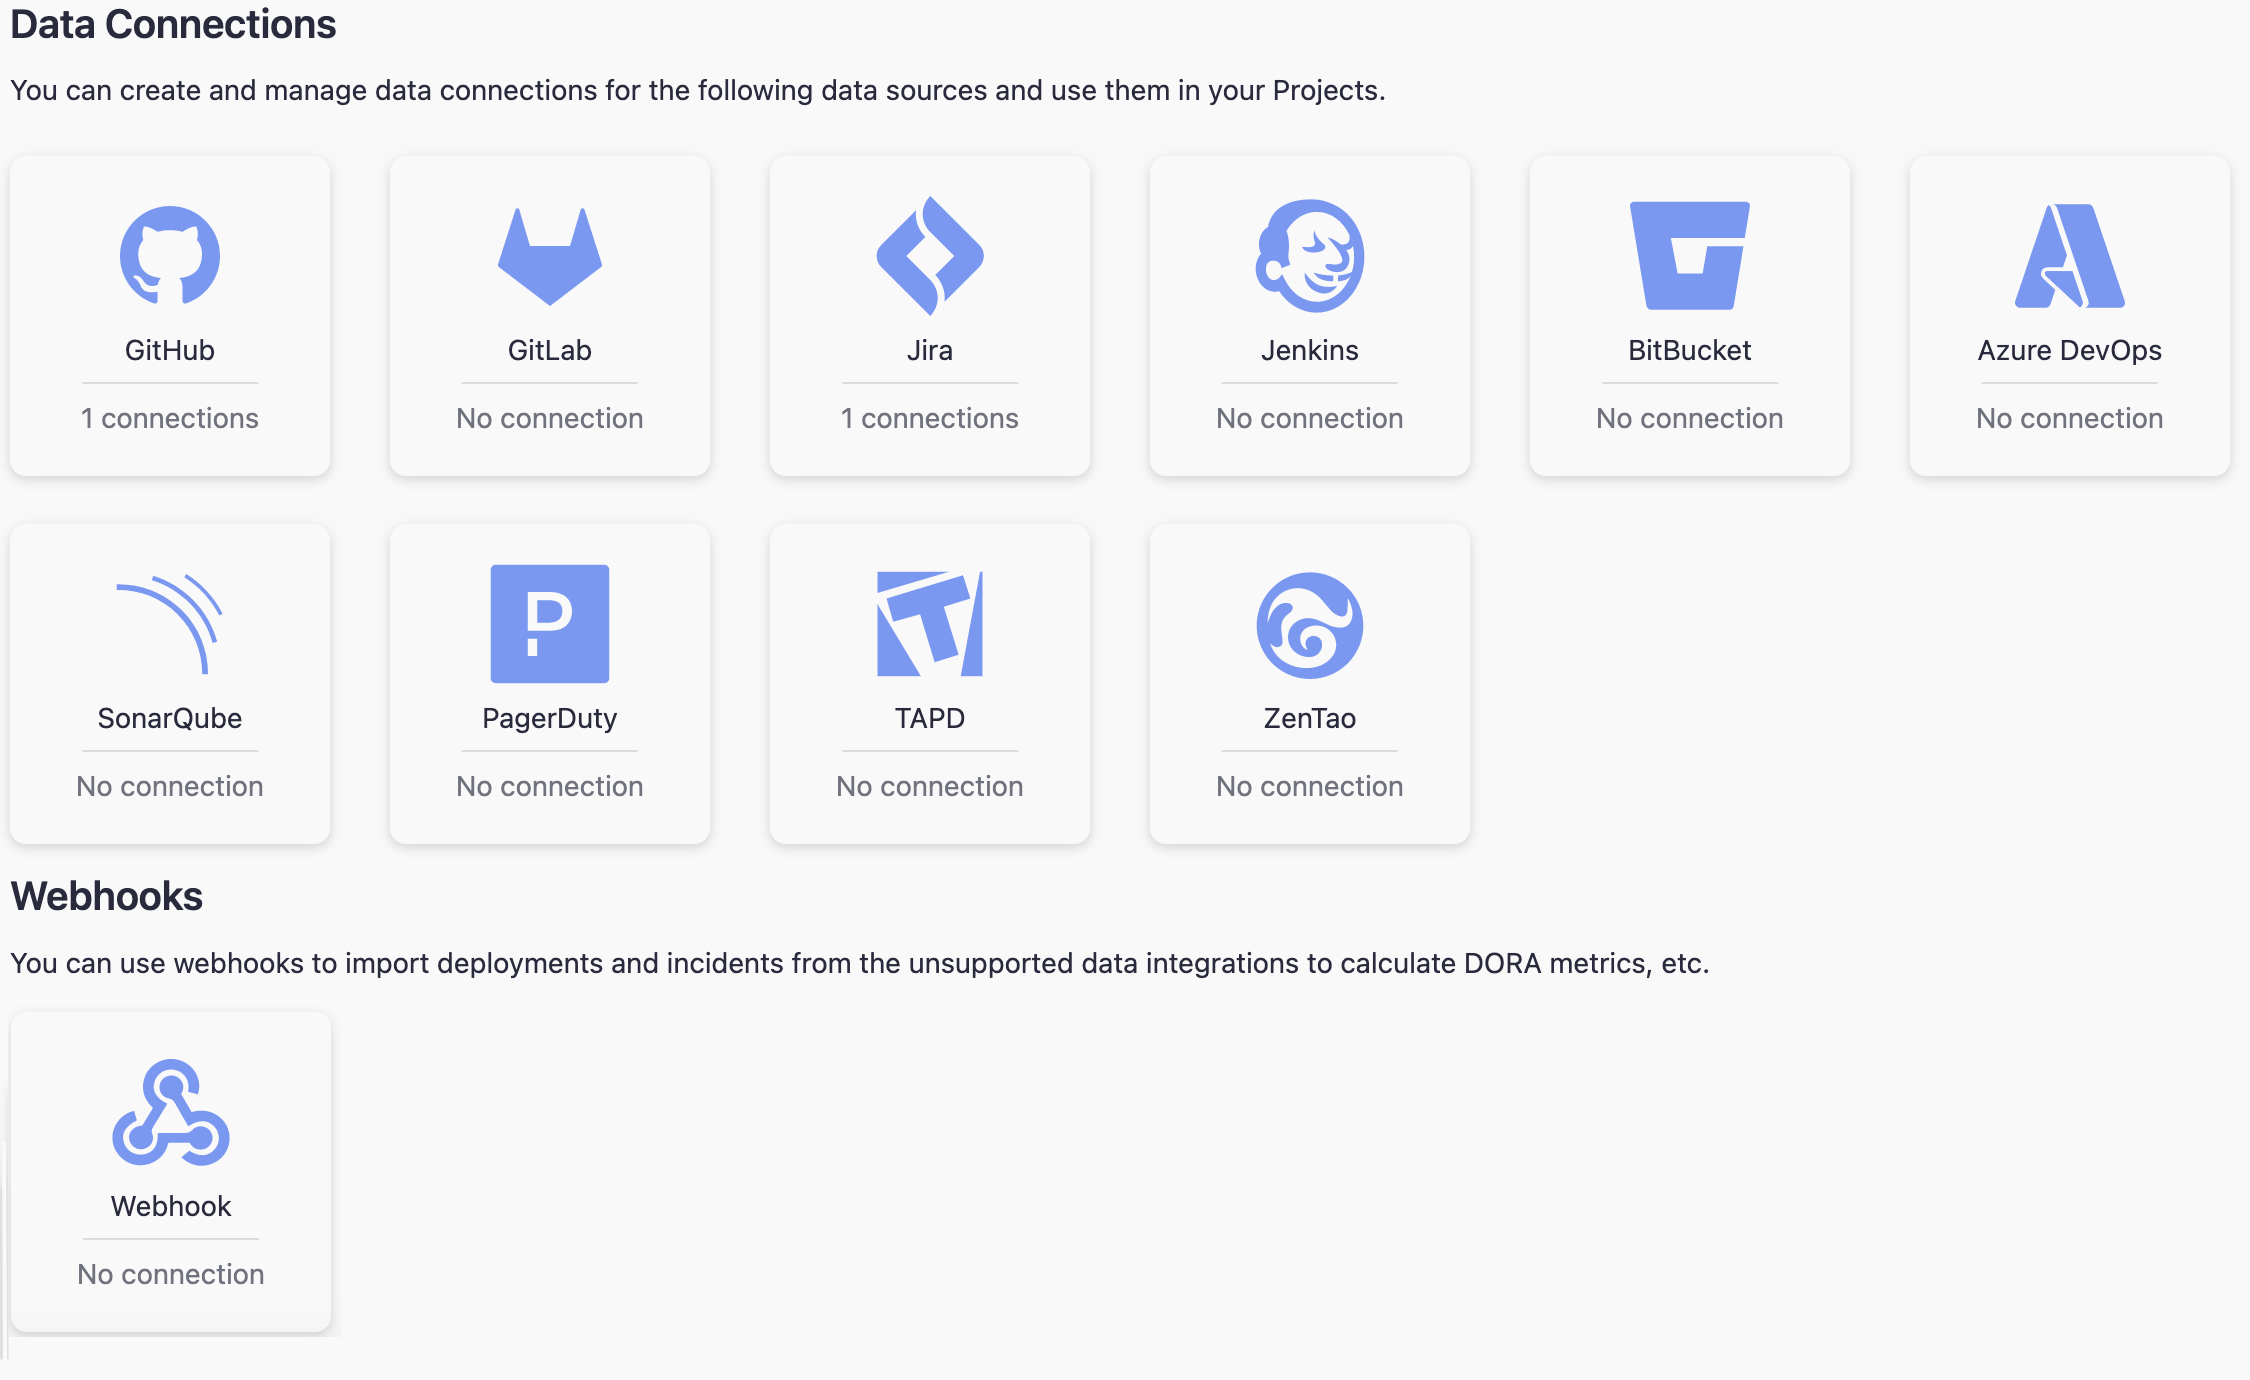
The decision to adopt DevLake was made after thoroughly comparing multiple solutions, like LinearB, Code Climate, Haystack, and Sleuth. We sought a system capable of offering deep, actionable insights into our workflow and output. DevLake’s capacity to integrate with numerous data sources to provide a cohesive view of team performance plus the fact that it is an open-source tool was desirable.
However, the integration process presented its challenges. The first of them was the manual nature of configuration and deployment via Helm. A guided, automated approach, perhaps through a tool like Terraform, would significantly enhance the user experience. Additionally, while the insights from DevLake pod logs were invaluable, the user interface was not intuitive, providing minimal information at first glance. Our experimentation with custom fields was unsuccessful, leading us to sideline this feature temporarily.
Cluster migration was also a trying ordeal. Our initial attempt to transition DevLake to a new cluster encountered complications, resulting in a considerable setback. The problems involved seeing a perpetual “Upgrade in process” message in the GUI, while getting errors behind the scenes about volume persistence. This made starting anew necessary, involving the creation of a new database, provisioning new persistent volumes, and installing a new DevLake instance. Despite the delays this approach caused, it offered us a clean slate and confirmed DevLake’s data management capabilities, ensuring data integrity and availability during migration.
Reflecting on these experiences, the importance of thorough planning and the need for a more streamlined migration process became apparent, highlighting areas for potential improvement in our approach.
Despite these hurdles, our engagement with DevLake can be deemed a success. Once configured, the platform’s performance exceeded our expectations with most features functioning seamlessly “out of the box.” Our decision to utilise a managed Grafana instance, instead of the default deployment, paid off. It provided easy customisation to have dashboards reflecting our reality and objectives. The comprehensive documentation provided by DevLake, coupled with the quick and always-present support of its knowledgeable community, was instrumental in this process. They helped with overcoming the initial learning curve and subsequent challenges.
So after going through all the steps to make DevLake a reality for our teams, what do our dashboards look like?
We started by setting up the DORA dashboard. Since Dora is a powerful industry standard, starting with it would provide holistic preliminary feedback on our velocity and productivity as we continue to address the issues we’ve faced and configure other boards.
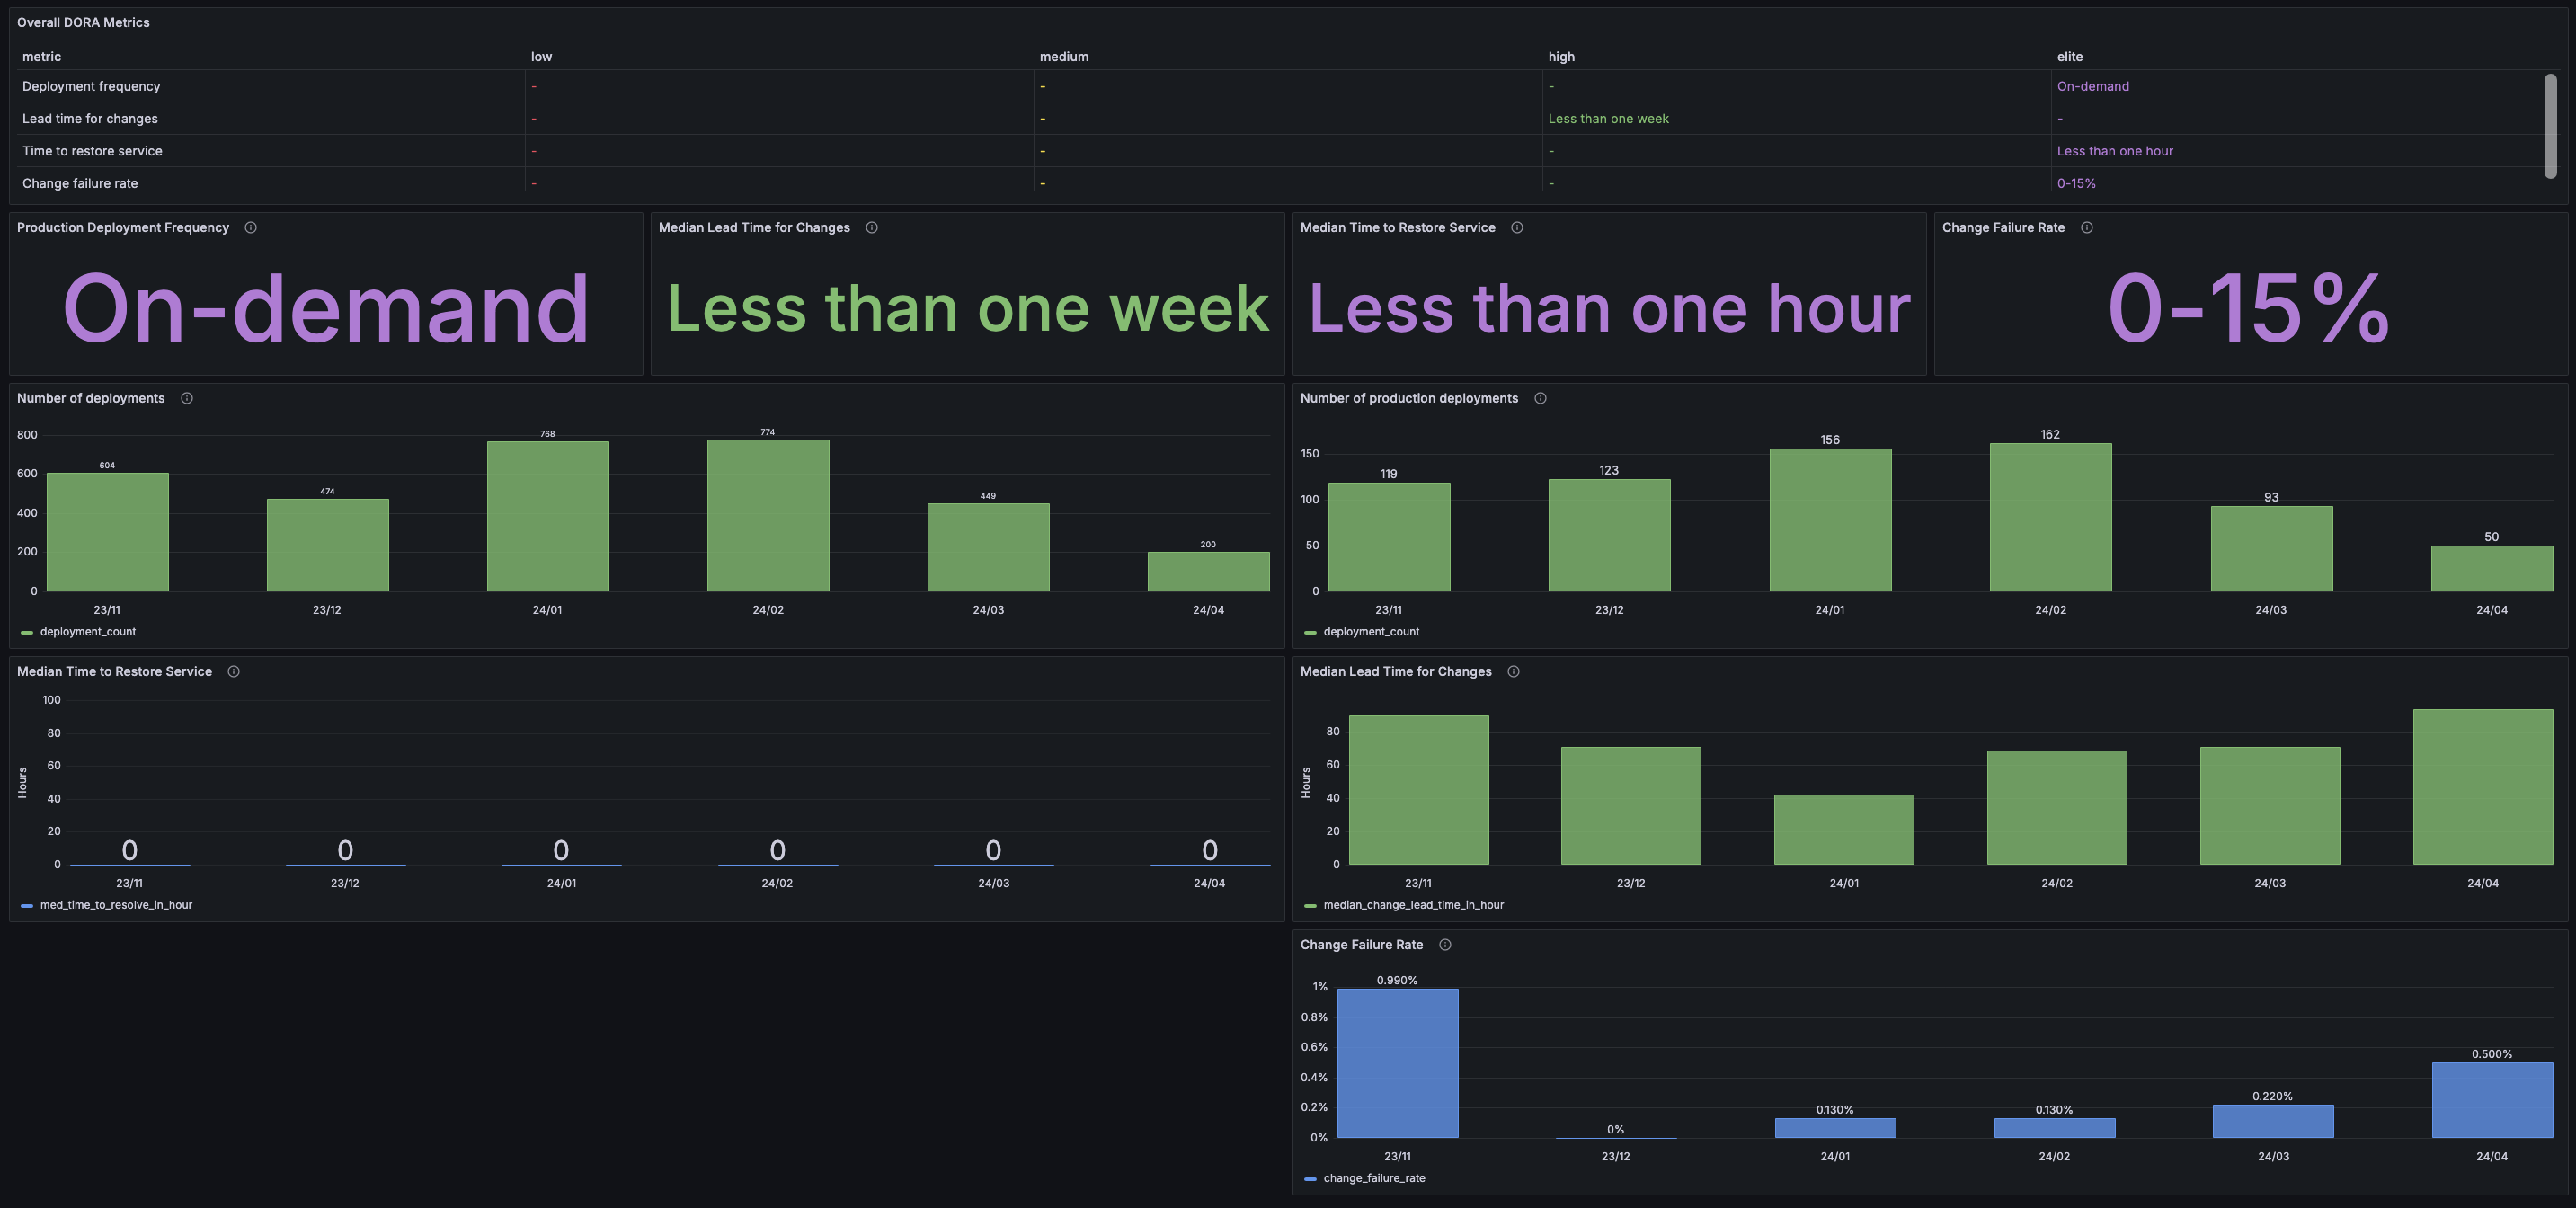
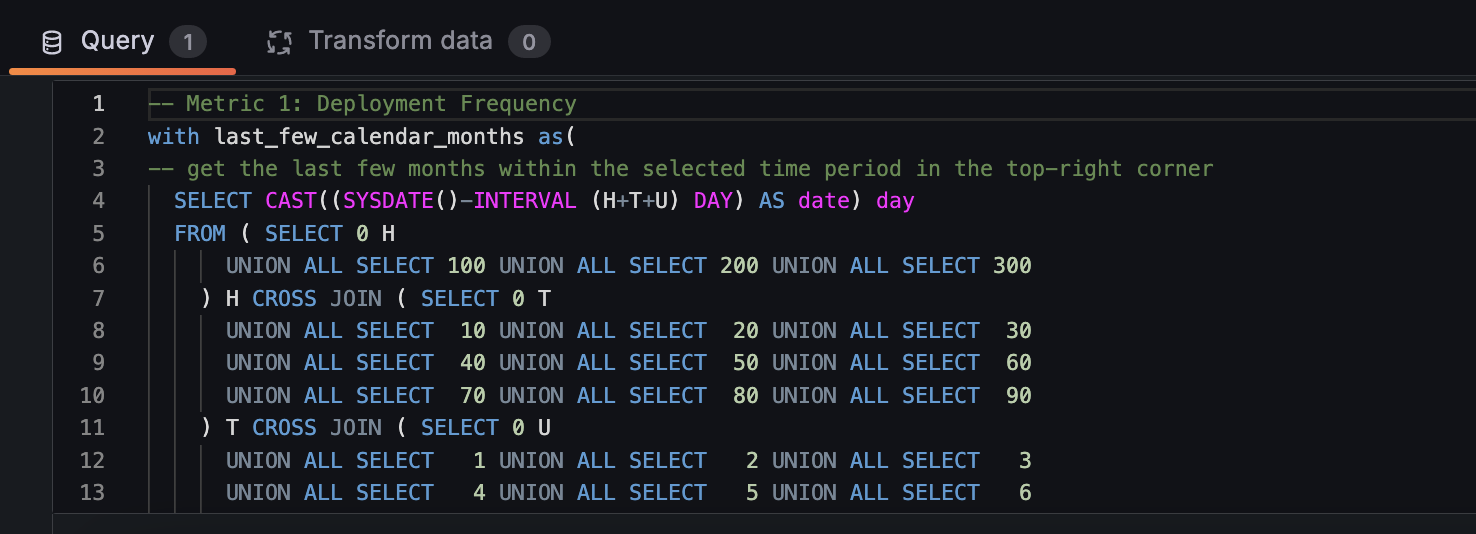
The benchmark table on the top and the usage of colours make it very easy to identify how well the team is doing and which things could use more of our attention. As mentioned before, we decided to use our Grafana, so we quickly imported the prebuilt graphs and made some minor changes. With Grafana being a versatile tool, anyone with some SQL knowledge can tweak the queries to suit their needs.
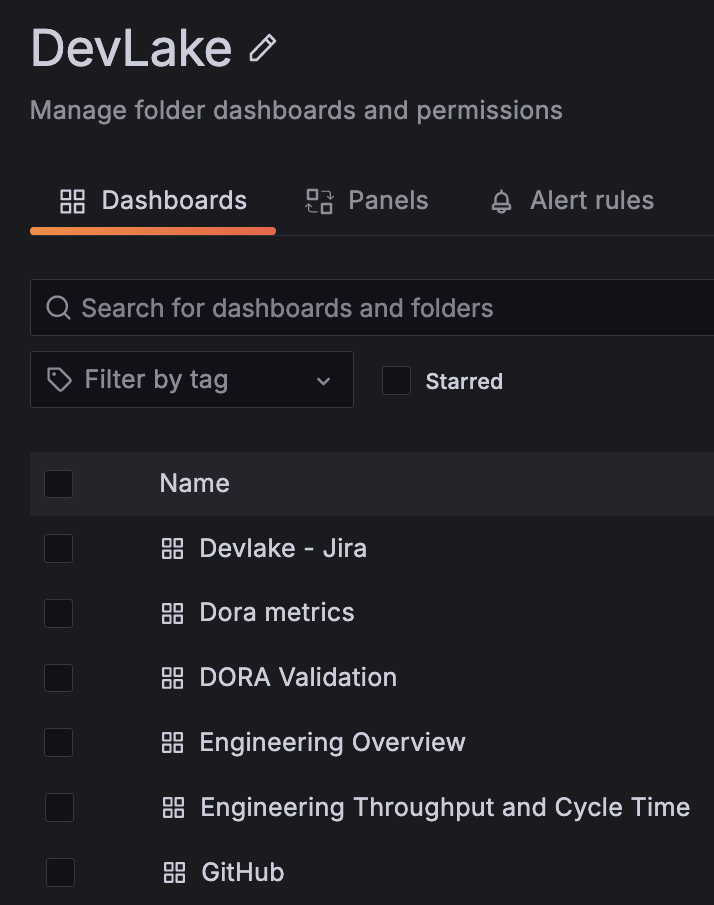
With that done, we took our time to build the other dashboards:
Jira and GitHub dashboards are straightforward, giving us metrics like Issue Delivery Rate Over Time, which tells us the ratio of delivered requirements to all requirements across time, and the Total Number of New Pull Requests per Month
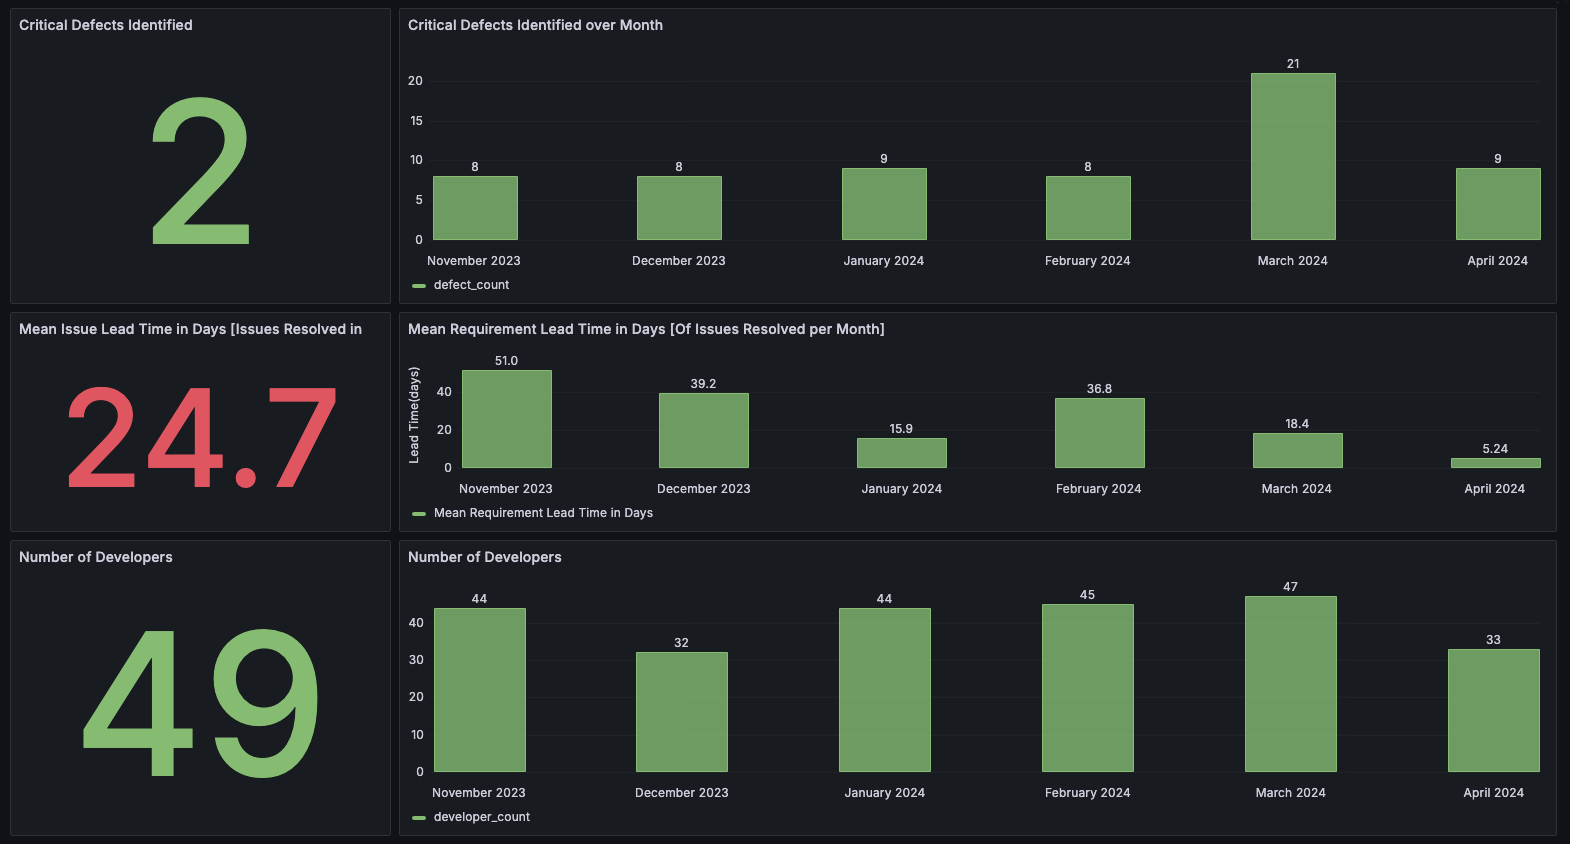
The Engineering Overview dashboard comprehensively looks at things like On-time Delivery, Critical Defects Identified Over Month, PR Merged Over Month, and Unlinked PRs, providing indicators of a team’s operational dynamics.
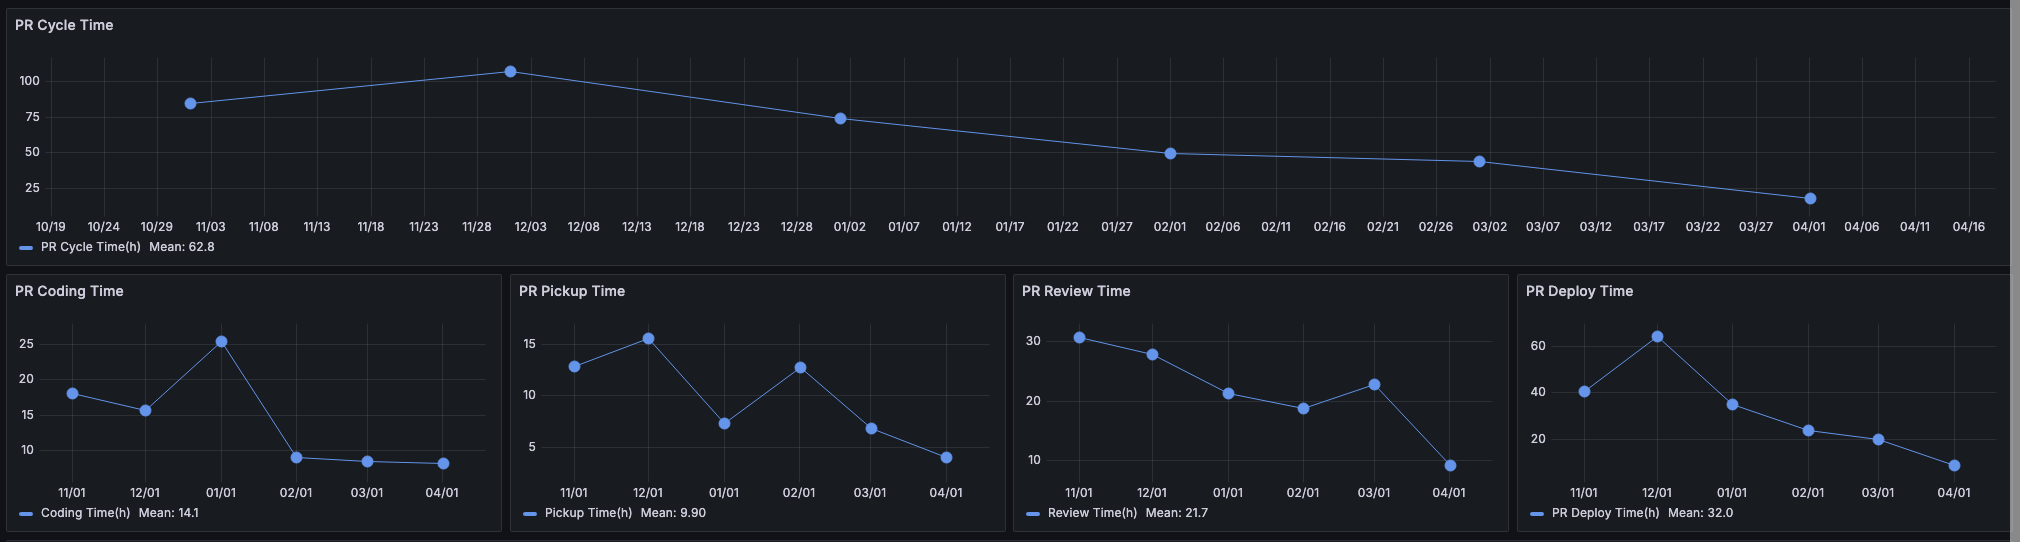
Engineering Throughput and Cycle Time board sheds light on the team’s speed by delivering insights into Cycle Time, Coding, Review, Pickup and Deploy Time, and on the team’s quality of development by presenting information on PRs that have been merged without review, the size of the PRs and the depth of our PR reviews.
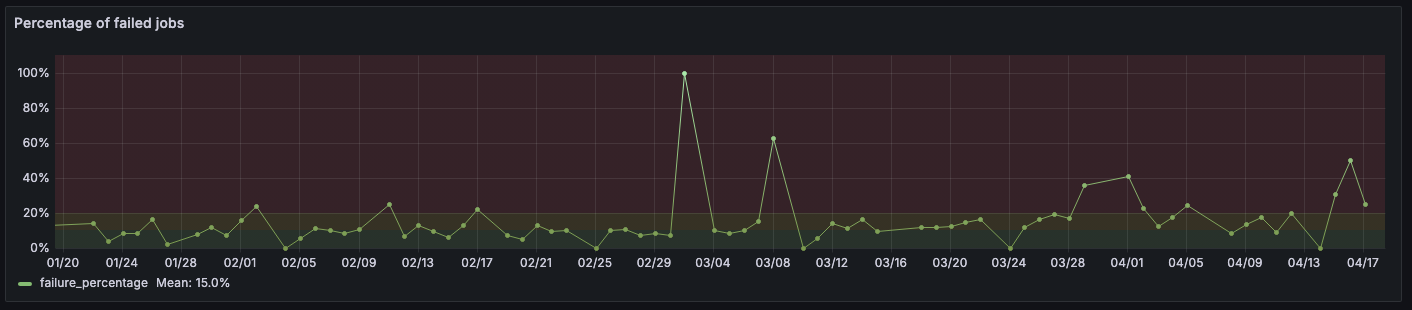
Finally, our last board is called Workflow Metrics. Created by our Platform team, this one centres on the quality of jobs for our different services, presenting the graphs:
- Duration of the Fastest Jobs;
- Duration of the Slowest Jobs;
- Most Executed Jobs;
- Total Jobs x Failed jobs;
- Percentage of Failed Jobs.
With the ability to mix and match data sources easily and again, with the versatility of Grafana, DevLake makes it easy for the teams to utilise the prebuilt graphs and construct new ones that can support their needs.
Finally, having utilised DevLake for several months, our experience has validated the platform’s robustness and transformative potential for not just assessing productivity, but more importantly, gauging overall team health.
As a practical illustration of how teams use DevLake data to drive improvements, they typically follow these steps:
- Identify an existing process issue;
- Refer to the DORA and Engineering Overview dashboards to establish baseline metrics that are likely influenced by the problem;
- Implement changes to correct the issue;
- Periodically review the dashboards at set intervals to monitor progress and determine if further adjustments are necessary.
DevLake is a solid tool that offers extensive customisation. It serves as an essential resource for teams that are dedicated to exploring their operational dynamics in-depth. By revealing insights with DevLake, teams can identify and address underlying issues, which enhances productivity and efficiency. This reinforces our belief in the strategic value of the platform as a tool for informed decision-making and ongoing improvement, not only for small teams but also for the wider company.